Crew Dashboard Overview
The Crew Dashboard is ClientCove's manager view — a single page where someone running a team can see exactly what every team member has on their plate, who's overloaded, who has bandwidth, and how much got done this week. It pulls together data from Tasks, Tickets, and Projects into one workload summary per crew member.
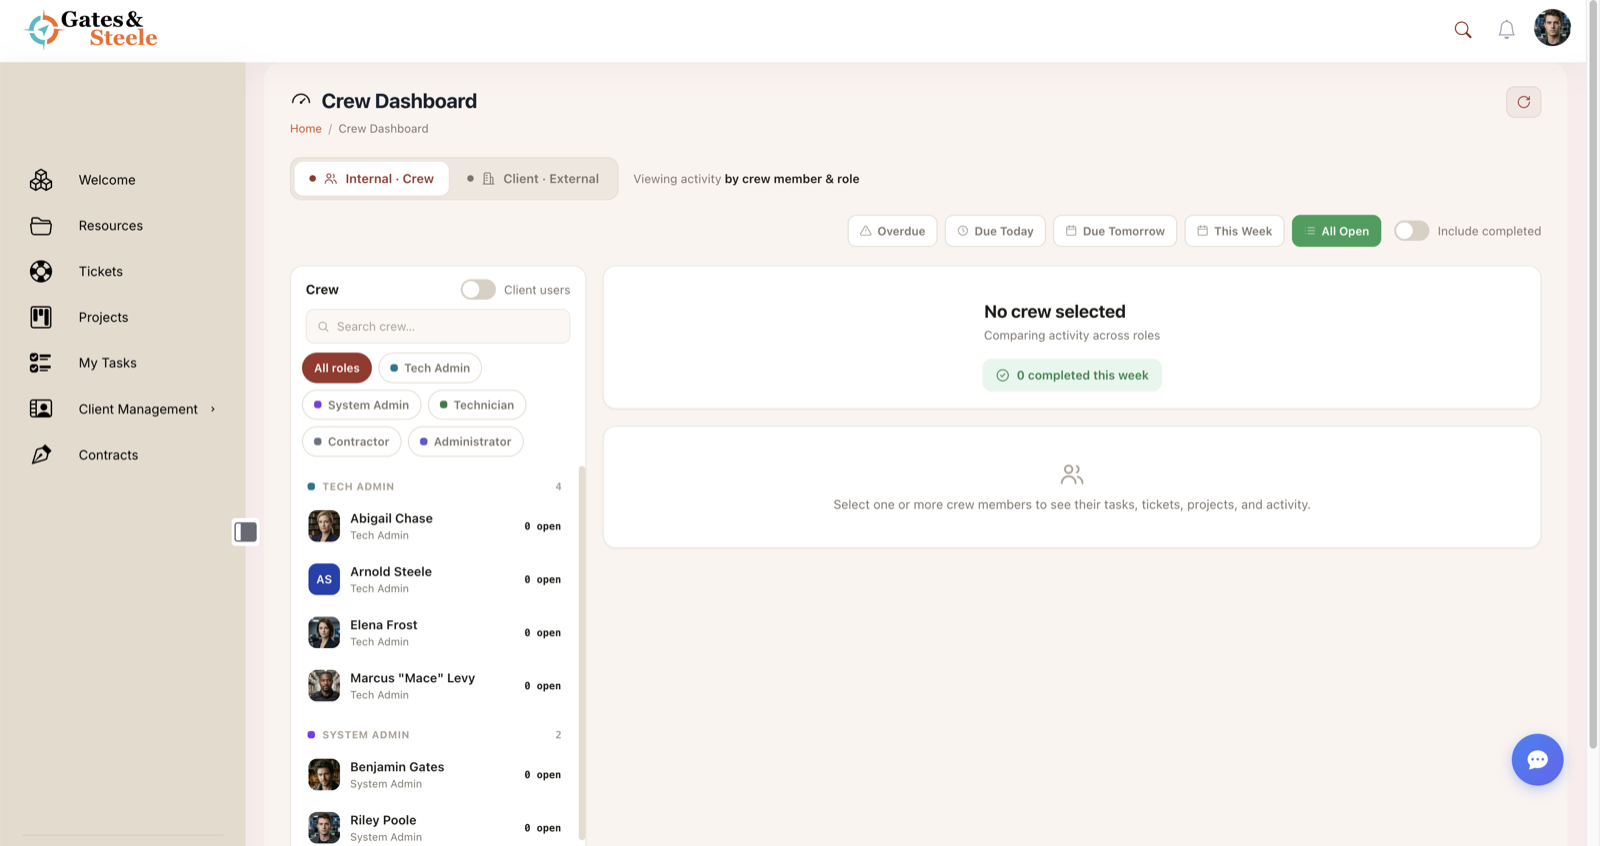
The Crew Dashboard — team members grouped by role with live workload.
What the Crew Dashboard Is
A manager-only page that:
- Lists every team member in a multi-select picker
- Aggregates each selected member's open work — tasks (manual + ticket-derived + project-derived), tickets they're assigned to, and projects they're a member of
- Filters by date urgency (Overdue / Today / Tomorrow / This Week / All Open)
- Shows a side-by-side comparison view when 2+ members are selected
- Shows a deep-dive detail view when a single member is selected
- Counts what's been completed this week as a velocity indicator
It's not a generic admin dashboard — it's specifically designed for the question "who's working on what right now?"
Why It Exists
Without the Crew Dashboard, getting visibility into team workload requires:
- Opening each feature (Tasks, Tickets, Projects)
- Filtering each one by assignee
- Mentally tallying counts
- Repeating for every team member
The Crew Dashboard collapses that to one page with one date filter. Managers can:
- Spot overload — see at a glance who has 40 open items vs who has 5
- Balance assignments — when a new task or ticket comes in, route it to whoever has bandwidth
- Track velocity — the "completed this week" counter shows whether the team is keeping up with intake
- Identify bottlenecks — a team member with 15 overdue items needs help or escalation
- Run check-ins — open the dashboard before a 1:1, get a complete view of what they're working on
Quick Glossary
| Term | What it means |
|---|---|
| Crew member | Any user that managers can oversee — typically internal team (admins, editors, technicians, contractors) |
| Crew Dashboard Manager | A user explicitly granted dashboard access via the Settings → Managers panel |
| Workload | The combined open tasks + tickets + projects for one crew member |
| Date Filter | Constrains the view to Overdue / Today / Tomorrow / This Week / All Open work |
| Comparison Mode | Side-by-side cards (one per crew member) shown when 2+ members are selected |
| Detail Mode | Single-member deep dive with accordion sections for Tasks / Tickets / Projects |
| Urgency | Calculated per task — Overdue / Today / Tomorrow / Normal — based on due date vs today |
| Completed This Week | Count of tasks marked complete in the last 7 days — the velocity metric |
What Gets Aggregated
For each selected crew member, the dashboard pulls:
Tasks
- Tasks where the crew member is the author
- Categorized by source: Ticket Tasks (created from a ticket via Add as Task), Project Tasks (auto-created from project card assignment), Manual Tasks (typed directly)
- Filtered by completion status (incomplete by default, "Include Completed" toggle to expand)
- Filtered by urgency (Overdue / Today / Tomorrow / This Week / All Open)
See Tasks for the underlying model.
Tickets
- Tickets the crew member is assigned to
- Includes status (Open / In Progress / Pending / Hold / Closed)
- Filtered by status when relevant
Projects
- Projects where the crew member is listed as a project member
- Includes project status and last update date
The aggregation runs server-side via get_user_workload_aggregate(), returning a single workload object per user with three lists (tasks / tickets / projects) and a stats summary.
Two View Modes
The dashboard switches between modes based on how many crew members you've selected:
Comparison Mode (2+ members)
- One card per selected member, laid out in a responsive grid (3 cards per row on desktop)
- Each card shows the same compact summary: total tasks, total tickets, total projects, key urgency badges
- Designed for at-a-glance comparison — you can scan and see which team members are loaded vs available
Detail Mode (1 member)
- Single full-width view of one member
- Top: stats summary cards (Tasks / Tickets / Projects) with breakdowns
- Below: collapsible accordion sections — Tasks, Tickets, Projects
- Each section shows a full table of items with title, due date, priority, related entity
- Tasks expand inline to show notes when clicked
Switch between modes by adjusting the multi-select — pick one for detail, pick many for comparison.
Stats It Surfaces
For each crew member, the workload payload includes:
Tasks stats
- Total Tasks — count of incomplete (or all if "Include Completed" is on) tasks
- Overdue Tasks — past due date
- Today Tasks — due today
- Week Tasks — due today / tomorrow / this week
- No Due Date Tasks — open with no date set
- Ticket Tasks — created from tickets
- Project Tasks — created from project cards
- Manual Tasks — typed in My Tasks
Tickets stats
- Total Tickets — count assigned
- Open Tickets — status = Open
- In Progress Tickets — status = In Progress / In-Progress
Projects stats
- Total Projects — count where the user is a member
Velocity
- Completed This Week — total tasks marked complete in the last 7 days
This roll-up is what powers the comparison-mode cards and the detail-mode summary section.
Where to Find It
The Crew Dashboard is at /crew-dashboard/. It surfaces in two places in the UI:
User dropdown menu — Admin Utilities
Authorized managers see a Crew Dashboard link in the Admin Utilities section of the user dropdown (the menu that opens from your avatar in the top-right corner). The same dropdown section also lists other manager tools like Email Campaigns, Agreements, Dashboards, and Invoices.
The link is gated by can_access_crew_dashboard() AND a check that at least one of Tasks / Tickets / Projects is enabled portal-wide. Users who don't pass both checks simply don't see the link.
Direct URL
Bookmark /crew-dashboard/ for one-click access. Unauthorized users hitting the URL are redirected to home with ?access=denied&reason=managers_only.
Who Can Access It
Access is explicit, not role-based. Even an administrator doesn't automatically get access — they have to be added to the Crew Dashboard Managers list in Settings → Managers.
This is intentional:
- Not every admin needs (or wants) workload visibility
- Smaller portals might have one designated team lead
- Larger portals can grant access to multiple people without making them all admins
See Setup & Permissions for how to grant access.
If a feature is disabled portal-wide (Tasks, Tickets, or Projects all toggled off), the Crew Dashboard redirects to home with ?access=denied&reason=features_disabled. The dashboard needs at least one of the three features enabled to have anything to show.
The Crew Dashboard is read-only. Managers can see what each team member has on their plate, but they can't reassign work from this view. Reassignment happens in the source feature (Tasks, Tickets, Projects) — the dashboard's job is visibility, not workflow. If you want to move a task from one person to another, click into the task and change its assignee there.